Stop Hunt Indicator ║ BullVision 🧠 Overview
The Stop Hunt Indicator (SmartTrap Radar) is an original tool designed to identify potential liquidity traps caused by institutional stop hunts. It visually maps out historically significant levels where price has repeatedly reversed or rejected — and dynamically detects real-time sweep patterns based on volume, structure, and candle rejection behavior.
This script does not repurpose existing public indicators, nor does it use default TradingView built-ins such as RSI, MACD, or MAs. Its core logic is fully proprietary and was developed from scratch to support discretionary and data-driven traders in visualizing volatility risks and manipulation zones.
🔍 What the Indicator Does
This indicator identifies and visualizes potential stop hunt zones using:
Historical structure analysis: Swing highs/lows are identified via a configurable lookback period.
Liquidity level tracking: Once detected, levels are monitored for touches, age, and volume strength.
Proprietary scoring model: Each level receives a real-time significance score based on:
Age (how long the level has held)
Number of rejections (touches)
Relative volume strength
Proximity to current price
The glow intensity of plotted levels is dynamically mapped based on this score. Bright glow = higher institutional interest probability.
⚙️ Stop Hunt Detection Logic
A stop hunt is flagged when all of the following are met:
Price sweeps through a high/low beyond a user-defined penetration threshold
Wick rejection occurs (i.e., candle closes back inside the level)
Volume spikes above the average in a recent window
The script automatically:
Detects bullish stop hunts (below support) and bearish ones (above resistance)
Marks detected sweeps on-chart with optional 🔰/🚨 signals
Adjusts glow visuals based on score even after the sweep occurs
These sweeps often precede local reversals or high-volatility zones — this is not predictive, but rather a reactive mapping of market manipulation behavior.
📌 Why This Is Not Just Another Liquidity Tool
Unlike typical liquidity heatmaps or S/R indicators, this script includes:
A proprietary significance score instead of fixed rules
Multi-layer glow rendering to reflect level importance visually
Real-time scoring updates as new volume and touches occur
Combined volume × rejection × structure logic to validate stop hunts
Fully customizable detection logic (lookback, wick %, volume filters, max bars, etc.)
This indicator provides a specialized view focused solely on visualizing trap setups — not generic trend signals.
🧪 Usage Recommendations
To get started:
Add the indicator to your chart (volume-enabled instruments only)
Customize detection:
Lookback Period for structure
Penetration % for how far price must sweep
Volume Spike Multiplier
Wick rejection strength
Enable/disable features:
Glow effects
Hunt markers
Score labels
Volume highlights
Watch for:
🔰 Bullish Sweeps (below support)
🚨 Bearish Sweeps (above resistance)
Bright glowing zones = high-liquidity targets
This tool can be used for both confluence and risk assessment, especially around high-impact sessions, liquidation events, or range extremes.
📊 Volume Dependency Notice
⚠️ This indicator requires real volume data to function correctly. On instruments without volume (e.g., synthetic pairs), certain features like spike detection and scoring will be disabled or inaccurate.
🔐 Closed-Source Disclosure
This script is published as invite-only to protect its proprietary scoring, glow mapping, and detection logic. While the full implementation remains confidential, this description outlines all key mechanics and configurable logic for user transparency.
Search in scripts for "swing high low"

Suvorov Pro SFP+Indicator: Logic-based Swing Failure Pattern (SFP)
What is the logic of my indicator based on and what makes it unique:
1. The indicator can calculate extreme candles that close with huge shadows and a small body and it works on any timeframe.
2. The indicator analyzes the volumes on which the desired bar was closed. This function is customizable. That is, you can build a search for signals according to your trading strategy, based on the number of volumes. What does this mean - you select the number of previous bars where the indicator calculates the average value and based on these numbers, you can set up: how many times the desired candle should be larger than the previous average volume.
3. Since SFP is based on the removal of important liquidity, the search for such situations occurs from swing structures (swing high/low). When these parameters are found on the chart (on history), the indicator draws the situation and shows where important liquidity was removed and why the trading situation appeared right now.
4. The indicator gives recommendations on possible takes and stops.
The structure of takes has a built-in logic for searching for previous swings to remove liquidity, as well as searching for imbalances to cover them (50 and 100%).
5. For TP (Take Profit): there are 3 TPthat can be adjusted to your trading strategy (Risk/Profit). For example: you always trade from 2 to 1 on the 1st Take, 3 to 1 on the second, 5 to 1 on the third: you can set all this in the indicator and all your targets will be detected by the indicator, taking into account the logic of searching for important ranges. If, for example, in your 3 to 1 range there are no important zones for TP, then the indicator writes that NaN (not found).
6. The indicator works on any timeframe.
7. The indicator has a built-in RSI logic, which comes as an additional function to the indicator. If this function is enabled, then trading situations are detected only when there is a divergence (from the swing point to the extreme bar that has formed).

Hybrid Swing/Day Alert System - PLATINUM EditionThis indicator is a complete trading assistant designed for crypto swing and day traders, built to identify high-probability long and short setups based on a multi-confirmation system.
Strategy Logic
The system scans and confirms entries only when 6 major confluences align:
1. EMA Trend: Price is above or below the EMA 9, 21, and 200 (bullish or bearish trend).
2. RSI Zone: RSI(14) is between 40-60 (ideal reversal zone).
3. Volume Confirmation: Volume is declining on pullback and then spikes.
4. Accumulation/Distribution: A/D line rising (for longs) or falling (for shorts).
5. Fibonacci Pullback Zone: Automatic detection of swing high/low and checks if price is inside the golden zone (0.5-0.618).
Built-In Alerts
- Long Setup Confirmed - Short Setup Confirmed - Setup Forming: Monitor
Conclusion
This script is ideal for disciplined traders who value confluence-based entries, risk/reward logic, and trend-aligned trades. Perfect for semi-automated trading via alerts or manual execution.6. Candle Pattern: Bullish (hammer, doji, engulfing) or Bearish (rejection wick, engulfing, doji).
Visual Features
- Long Entry: Green square
- Short Entry: Red triangle
- Pre-Signal Alert: Blue circle (confluence forming)
- Dynamic Table: Displays all 6 confirmations in real time
- Fibonacci Zones: Auto-plotted long/short retracement zones
- Customizable: Turn on/off alerts, overlays, and direction filters
Best Use Cases
- 4H/Daily: Trend confirmation
- 1H: Entry execution
- 15min: Scalping (use cautiously)
- Works great with BTC, ETH, SOL, XAU, and meme coins

Shockwave⚡️ Shockwave – Precision Momentum Strategy
🔹 Purpose
Shockwave is a precision-engineered trend and momentum strategy designed for aggressive, high-conviction trades. Built for volatile markets like crypto, this system enters only when trend, volume, and momentum are fully aligned — then exits intelligently using layered profit targets and trend weakening logic.
It filters out false breakouts, traps, and low-quality setups using advanced multi-factor confirmation. Ideal for trend-following traders who want cleaner signals, no repainting, and adaptive position handling.
🔹 Indicator Breakdown
1️⃣ ZLEMA + Gradient Filter (Trend Core)
Defines the trend using a Zero Lag EMA (ZLEMA) for responsiveness.
Gradient slope confirms acceleration or weakening in trend direction.
Uptrend: ZLEMA is rising and slope > 0.
Downtrend: ZLEMA is falling and slope < 0.
2️⃣ Smoothed CCI (Momentum Confirmation)
Uses ZLEMA as the source for CCI to avoid noise.
Bullish momentum: CCI rising above 0.
Bearish momentum: CCI falling below 0.
Filters out chop and premature entries.
3️⃣ Volume Spike Filter
Median-based filter confirms breakout volume integrity.
Requires volume > 1.5x median of previous candles.
Avoids low-volume whipsaws.
4️⃣ Vortex Indicator (Trend Strength Confirmation)
Confirms directional conviction by comparing VI+ vs VI–.
Long: VI+ > VI– and threshold difference is met.
Short: VI– > VI+ and trend strength is validated.
5️⃣ Wick Trap Filter (Reversal Trap Detection)
Blocks entries on manipulative upper/lower wick patterns.
Longs rejected if upper wick > 1.5× body and close is weak.
Shorts rejected if lower wick > 1.5× body and close is strong.
🔹 Strategy Logic & Trade Execution
✅ Entry Conditions
A trade is entered only when all the following align:
ZLEMA trend direction is confirmed.
CCI momentum matches the trend.
Volume spike confirms participation.
Vortex difference meets strength threshold.
No wick trap is present.
✅ Exit Conditions
TP1: 50% of the position is closed at the first profit level.
TP2: Remaining 50% is closed at the second target.
Weak Trend Exit: If ZLEMA slope flips against the trade, the position is closed early.
A 1-bar cooldown delay is enforced after closing to prevent same-bar reentry.
🔹 Take-Profit System
TP1: 50% close at +2% for longs / –2% for shorts
TP2: Full close at +4% for longs / –4% for shorts
Limit orders are used for precise profit-taking
TP1/TP2 status is tracked and displayed in the live dashboard
🔹 Risk Management (Important)
🚫 This strategy does not include a stop-loss by default.
Trades are exited using trend reversal detection or TP targets.
💡 Suggested risk controls:
Add a manual stop-loss based on recent swing high/low
Use appropriate position sizing based on volatility
Apply the strategy in strong trending environments
🔹 Default Backtest Settings
Initial Capital: $1,000
Position Size: 10% of equity per trade
Commission: 0.05%
Slippage: 1
Strategy Date Filter: Adjustable (default: 2023–2029)
🔹 How to Use Shockwave
Apply to any chart (best results on 1H or higher).
Review backtest performance.
Adjust take-profit percentages or thresholds as needed.
Use in strongly trending markets — avoid sideways ranges.
Add your own stop-loss if desired.
⚠️ Disclaimer
This strategy is for educational and informational purposes only. It is not financial advice. Trading involves risk, and past performance does not guarantee future results. Always test thoroughly and manage your own risk.
🚀 Why Use Shockwave?
✔ Multi-layer confirmation for high-quality entries
✔ Non-repainting logic for backtest/live consistency
✔ Adaptive trend/momentum filtering
✔ Dual profit targets for smart trade management
✔ Visual dashboard with live tracking

NexAlgo AI with Dynamic TP/SLThe NexAlgo Indicator combines a Gaussian kernel regression engine with adaptive volatility thresholds to generate clear, data‑driven trade signals and built‑in risk levels. It predicts the next bar’s price relative to a simple moving average, then measures the average deviation between actual and forecasted values to form dynamic bands. Breakouts beyond these bands, aligned with the prediction’s direction, produce buy or sell signals directly on your chart.
How It Works & What You’ll See
Kernel Regression Forecast: A rolling “lookback” window builds a Gaussian similarity matrix of recent prices. This matrix is used to project the next price, smoothing around a moving average.
Adaptive Volatility Bands: The indicator computes the mean absolute error between actual and predicted prices, multiplies it by your chosen volatility factor, and plots upper and lower bands.
Signal Triggers: When price closes above the upper band while the prediction is rising, a green “BUY” label appears; when price closes below the lower band as the forecast falls, a red “SELL” label is shown.
Automatic SL/TP Levels: After each signal, the script scans recent swing highs/lows and applies an ATR buffer. Stop‑loss is set conservatively at the more protective of these levels, while take‑profit is calculated by your reward‑to‑risk ratio and capped near the opposite swing extreme.
Customizable Inputs
Lookback Period & Smoothing: Adjust how many bars the regression and volatility calculations use, and tune the noise regularization to suit fast or slow markets.
Volatility Multiplier: Widen or tighten the adaptive bands to control signal frequency and confidence.
Swing Lookback & ATR Options: Define how far back the indicator searches for swing points, and choose between ATR calculation methods.
Reward‑to‑Risk Ratio: Set your preferred multiple of stop‑loss distance for take‑profit targets.
What Makes NexAlgo Different
Hybrid Statistical Approach: Unlike fixed‑period moving averages or standard regression, the Gaussian kernel adapts locally to evolving price patterns and regimes.
Self‑Adjusting Thresholds: Volatility bands derive from prediction errors—so they expand in choppy markets and contract in trending conditions.
Integrated Risk Controls: Automatically calculated stop‑loss and take‑profit levels remove manual guesswork, yet remain grounded in both ATR and price structure.
Trader‑Driven Flexibility: Every parameter—from lookback length to risk ratio—can be dialed in for scalping, swing trading, or longer‑term strategies.
Getting Started
• Apply NexAlgo to your preferred timeframe (5–15 min for intraday scalps, 1 h–4 h for swings, daily for position plays).
• Begin with default settings and gradually adjust lookback and smoothing to balance responsiveness versus noise.
• Experiment with volatility multipliers: tighten in strong trends, widen when markets churn.
• Backtest different ATR buffers and reward ratios to discover your ideal risk‑reward profile.

Enhanced BarUpDn StrategyEnhanced BarUpDn Strategy
The Enhanced BarUpDn Strategy is a refined price action-based trading approach that identifies market trends and reversals using bar formations. It focuses on detecting bullish and bearish momentum by analyzing consecutive price bars and key support/resistance levels.
Key Features:
✅ Trend Confirmation – Uses a combination of bar patterns and indicators (e.g., moving averages, RSI) to confirm momentum shifts.
✅ Entry Signals – A buy signal is triggered when an "Up Bar" (higher high, higher low) follows a bullish setup; a sell signal when a "Down Bar" (lower high, lower low) confirms bearish momentum.
✅ Enhanced Filters – Incorporates volume analysis and additional conditions to reduce false signals.
✅ Stop-Loss & Risk Management – Uses recent swing highs/lows for stop placement and dynamic trailing stops for maximizing gains.

Multi-Timeframe MA Based Zigzag[liwei666]🎲 Overview
🎯 This Zigzag indicator build based on different MA such as EMA/HMA/RMA/SMA, support multi-timeframe setting .
you can get customer zigzag indicator by change short/long ma length and high-timeframe config(5m/15m/30m/1h/2h) in any symbol.
🎲 Indicator design logic
🎯 entired logic is simple and code looks complex, I‘ll explain core logic here, code already equipped with detailed comments.
1. use close-in EMA's highest/lowest value mark as SWING High/Low when EMA crossover/under, not use func ta.pivothigh()/ta.pivotlow()
2. when EMA crossover/under plot a char as signal like ●/❄/▲, crossover get blue char crossunder get red char
3. latest zigzag line is not drawn until EMA is turned (crossover/under), but signal is realtime
4. you can see diff zigzag structure when you open high-timeframe config, then find regular pattern benefit your trading.
🎲 Settings
🎯 there are 3 group properties in script, just focus on 5 properties in 'GRP1' ,
'GRP2' and 'GRP3' are display config.
'GRP1':
MA_Type: MA type you can choose(EMA/RMA/SMA/HMA/WMA), default is EMA
short_ma_len: short MA length of your current timeframe on chart
long_ma_len: long MA length of your current timeframe on chart
htf_ma_len: MA length of high timeframe, MA type same as 'MA_Type' config
htf_ma_tf: high timeframe ma length, 15/30/60/120 minute
'GRP2':
• show_short_zz • show_long_zz • show_htf_zz:
'GRP3':
• show_short_ma_line • show_short_ma_signal
• show_long_ma_line • show_long_ma_signal
• show_htf_ma_line • show_htf_ma_signal
🎲 Usage
🎯 As we know, MA based signal usually worked fine in trend market , low volatility is unprofitable.
🎯 One of pattern as the chart show below.
1. success example : after a blue ▲ signal, entry long when blue ● signal appear, marked with green box.
2. failed example: after a blue ▲ signal, a red ▼ signal appear, marked with white box.
🎯 BoS(Break of Structure) based on ma zigzag is a good idea I'm implementing, it will be published in next script.
Additionally, I plan to publish 20 profitable strategies in 2023; this indicatior not one of them,
let‘s witness it together!
Hope this indicator will be useful for you :)
enjoy! 🚀🚀🚀

Simple and Profitable Scalping Strategy (ForexSignals TV)Strategy is based on the "SIMPLE and PROFITABLE Forex Scalping Strategy" taken from YouTube channel ForexSignals TV.
See video for a detailed explaination of the whole strategy.
I'm not entirely happy with the performance of this strategy yet however I do believe it has potential as the concept makes a lot of sense.
I'm open to any ideas people have on how it could be improved.
Strategy incorporates the following features:
Risk management:
Configurable X% loss per stop (default to 1%)
Configurable R:R ratio
Trade entry:
Based on stratgey conditions outlined below
Trade exit:
Based on stratgey conditions outlined below
Backtesting:
Configurable backtesting range by date
Trade drawings:
Each entry condition indicator can be turned on and off
TP/SL boxes drawn for all trades. Can be turned on and off
Trade exit information labels. Can be turned on and off
NOTE: Trade drawings will only be applicable when using overlay strategies
Debugging:
Includes section with useful debugging techniques
Strategy conditions
Trade entry:
LONG
C1: On higher timeframe trend EMAs, Fast EMA must be above Slow EMA
C2: On higher timeframe trend EMAs, price must be above Fast EMA
C3: On current timeframe entry EMAs, Fast EMA must be above Medium EMA and Medium EMA must be above Slow EMA
C4: On current timeframe entry EMAs, all 3 EMA lines must have fanned out in upward direction for previous X candles (configurable)
C5: On current timeframe entry EMAs, previous candle must have closed above and not touched any EMA lines
C6: On current timeframe entry EMAs, current candle must have pulled back to touch the EMA line(s)
C7: Price must break through the high of the last X candles (plus price buffer) to trigger entry (stop order entry)
SHORT
C1: On higher timeframe trend EMAs, Fast EMA must be below Slow EMA
C2: On higher timeframe trend EMAs, price must be below Fast EMA
C3: On current timeframe entry EMAs, Fast EMA must be below Medium EMA and Medium EMA must be below Slow EMA
C4: On current timeframe entry EMAs, all 3 EMA lines must have fanned out in downward direction for previous X candles (configurable)
C5: On current timeframe entry EMAs, previous candle must have closed above and not touched any EMA lines
C6: On current timeframe entry EMAs, current candle must have pulled back to touch the EMA line(s)
C7: Price must break through the low of the last X candles (plus price buffer) to trigger entry (stop order entry)
Trade entry:
Calculated position size based on risk tolerance
Entry price is a stop order set just above (buffer configurable) the recent swing high/low (long/short)
Trade exit:
Stop Loss is set just below (buffer configurable) trigger candle's low/high (long/short)
Take Profit calculated from Stop Loss using R:R ratio
Credits
"SIMPLE and PROFITABLE Forex Scalping Strategy" taken from YouTube channel ForexSignals TV

RSI Crossover AlertRSI Crossover Alert Indicator - User Guide
The RSI Crossover Alert Indicator is a comprehensive technical analysis tool that detects multiple types of RSI crossovers and generates real-time alerts. It combines traditional RSI analysis with signal lines, divergence detection, and multi-level crossing alerts.
1. Multiple Crossover Detection
- RSI/Signal Line Cross: Signals a primary trend change.
- RSI/Second Signal Cross: Confirmation signals for stronger trends.
- Level Crossings: Crosses of Overbought 70, Oversold 30, and Midline 50.
- Divergence Detection: Hidden and regular divergences for reversal signals.
2. Alert Types
- Alert: RSI > Signal
Description: Bullish momentum is building.
Signal: Consider long positions.
- Alert: RSI < Signal
Description: Bearish momentum is building.
Signal: Consider short positions.
- Alert: RSI > 70
Description: Entering the overbought zone.
Signal: Prepare for a potential reversal.
- Alert: RSI < 30
Description: Entering the oversold zone.
Signal: Watch for a bounce opportunity.
- Alert: RSI crosses 50
Description: A shift in momentum.
Signal: Trend confirmation.
3. Visual Components
- Lines: RSI blue, Signal orange, Second Signal purple
- Histogram: Visualizes momentum by showing the difference between RSI and the Signal line.
- Background Zones: Red overbought, Green oversold
- Markers: Up/down triangles to indicate crossovers.
- Info Table: Real-time RSI values and status.
Strategy 1: Classic Crossover
- Entry Long: RSI crosses above the Signal Line AND RSI is below 50.
- Entry Short: RSI crosses below the Signal Line AND RSI is above 50.
- Take Profit: On the opposite signal.
- Stop Loss: At the recent swing high/low.
Strategy 2: Extreme Zone Reversal
- Entry Long: RSI is below 30 and crosses above the Signal Line.
- Entry Short: RSI is above 70 and crosses below the Signal Line.
- Risk Management: Higher win rate but fewer signals. Use a minimum 2:1 risk-reward ratio.
Strategy 3: Divergence Trading
- Setup: Enable divergence alerts and look for price/RSI divergence. Wait for an RSI crossover for confirmation.
- Entry: Enter on the crossover after the divergence appears. Place the stop loss beyond the starting point of the divergence.
Strategy 4: Multi-Timeframe Confirmation
1. Check the higher timeframe e.g. Daily to identify the main trend.
2. Use the current timeframe e.g. 4H/1H for your entry.
3. Only enter in the direction of the main trend.
4. Use the RSI crossover as the entry trigger.
Optimal Settings by Market
- Forex Major Pairs
RSI Length: 14, Signal Length: 9, Overbought/Oversold: 70/30
- Crypto High Volatility
RSI Length: 10-12, Signal Length: 6-8, Overbought/Oversold: 75/25
- Stocks Trending
RSI Length: 14-21, Signal Length: 9-12, Overbought/Oversold: 70/30
- Commodities
RSI Length: 14, Signal Length: 9, Overbought/Oversold: 80/20
Risk Management Rules
1. Position Sizing: Never risk more than 1-2% on a single trade. Reduce size in ranging markets.
2. Stop Loss Placement: Place stops beyond the recent swing high/low for crossovers. Using an ATR-based stop is also effective.
3. Profit Taking: Take partial profits at a 1:1 risk-reward ratio. Switch to a trailing stop after reaching 2:1.
1. Filtering Signals
- Combine with volume indicators.
- Confirm the trend on a higher timeframe.
- Wait for candlestick pattern confirmation.
2. Avoid Common Mistakes
- Don't trade every single crossover.
- Avoid taking signals against a strong trend.
- Do not ignore risk management.
3. Market Conditions
- Trending Market: Focus on midline 50 crosses.
- Ranging Market: Look for reversals from overbought/oversold levels.
- Volatile Market: Widen the overbought/oversold levels.
- If you get too many false signals:
Increase the signal line period, add other confirmation indicators, or use a higher timeframe.
- If you are missing major moves:
Decrease the RSI length, shorten the signal line period, or check your alert settings.
Recommended Combinations
1. RSI + MACD: For dual momentum confirmation.
2. RSI + Bollinger Bands: For volatility-adjusted signals.
3. RSI + Volume: To confirm the strength of a signal.
4. RSI + Moving Averages: To use as a trend filter.
This indicator provides a comprehensive RSI analysis. Success depends on proper configuration, risk management, and combining signals with the overall market context. Start with the default settings, then optimize based on your trading style and market conditions.

GOXXIE H4 S/R + Volume Zones + Alerts [For GOLD Day Traders]This advanced indicator identifies key trading levels by combining:
H4 Timeframe Support/Resistance
Automatically detects swing highs/lows from the 4-hour chart
Plots them on your current timeframe (perfect for day traders)
Only shows confirmed levels (adjustable from 1-5 touches)
Volume Confirmation
Highlights high-volume zones from the H4 timeframe
Purple shading shows where institutions traded actively
Proximity Alerts
Customizable alerts when price approaches key levels (0.1%-5% distance)
Prevents missed opportunities at critical zones
Key Features:
✅ Multi-Timeframe Analysis - See H4 structure while trading lower timeframes
✅ Volume-Filtered Levels - Avoid false breaks with volume confirmation
✅ Customizable Sensitivity - Adjust touch requirements and alert distances
✅ Clean Visualization - Dashed lines (red=resistance, green=support) with subtle volume shading
Ideal For:
Day traders who need to align with higher timeframe structure
Swing traders looking for confluent support/resistance zones
Breakout/Reversal strategies with volume confirmation
Input Parameters:
Higher Timeframe (H4) - Base timeframe for level detection
Min Touches - How many times a level must be tested (1-5)
Volume Threshold - Sensitivity for high-volume zones (0.1-2.0)
Alert Distance - How close price must be to trigger alerts (0.1%-5%)
Pro Tips:
Combine with:
Trend confirmation (e.g., 200 EMA)
Candlestick patterns at key levels
Strongest signals occur when:
Price tests H4 level + volume zone simultaneously
Lower timeframe shows rejection (wick) or breakout (close beyond level)
Publishing Notes:
Categories: Strategy > Support/Resistance > Volume
Tags: support, resistance, volume, daytrading, multitimeframe
Preview Image: Show a chart with:
H4 levels on a 15m chart
Purple volume zones
Example alerts popping up
50/100 EMA Crossover with Candle Confirmation📘 **50/100 EMA Crossover with Candle Confirmation – Strategy Description**
The **50/100 EMA Crossover with Candle Confirmation** is a trend-following strategy designed to filter high-probability entries by combining exponential moving average (EMA) crossovers with strong price action confirmation. This strategy aims to reduce false signals commonly associated with EMA-only systems by requiring a **candle close confirmation in the direction of the trend**, making it more reliable for intraday or swing trading across Forex, crypto, and stock markets.
---
### 🔍 **Core Logic**
* The strategy is based on the interaction of the **50 EMA** (fast-moving average) and the **100 EMA** (slow-moving average).
* **Trend direction** is determined by the crossover:
* **Bullish Trend**: When the 50 EMA crosses **above** the 100 EMA.
* **Bearish Trend**: When the 50 EMA crosses **below** the 100 EMA.
* To **filter out false breakouts**, a **candle confirmation** is used:
* For a **Buy signal**: After a bullish crossover, wait for a strong bullish candle (e.g., full-body green candle) to **close above both EMAs**.
* For a **Sell signal**: After a bearish crossover, wait for a strong bearish candle to **close below both EMAs**.
---
### ✅ **Entry Conditions**
**Buy Entry:**
* 50 EMA crosses above 100 EMA.
* Latest candle closes **above both EMAs**.
* Candle must be bullish (green/full body preferred).
**Sell Entry:**
* 50 EMA crosses below 100 EMA.
* Latest candle closes **below both EMAs**.
* Candle must be bearish (red/full body preferred).
---
### 🛑 **Exit or Take-Profit Options**
* **Fixed TP/SL**: 1:2 or 1:3 risk-reward.
* **Trailing Stop**: Based on recent swing highs/lows or ATR.
* **EMA Exit**: Exit trade when the candle closes on the opposite side of 50 EMA.
---
### ⚙️ **Best Settings**
* **Timeframes**: 5M, 15M, 1H, 4H (works well on most).
* **Markets**: Forex, Crypto (e.g., BTC/ETH), Indices (e.g., NASDAQ, NIFTY50).
* **Recommended filters**:
* Use with RSI divergence or volume confirmation.
* Avoid using during high-impact news (especially on lower timeframes).
---
### 🧠 **Why This Works**
The 50/100 EMA crossover provides a **medium-term trend signal**, reducing noise seen in fast EMAs (like 9 or 21). The candle confirmation adds a **momentum filter**, ensuring price supports the directional bias. This makes it suitable for traders who want a balance of trend and entry precision without overcomplicating with too many indicators.
---
### 📈 **Advantages**
* Simple yet effective for identifying trends.
* Filters out fakeouts using candle confirmation.
* Easy to automate in Pine Script or other trading bots.
* Can be combined with support/resistance or SMC zones for better confluence.
---
### ⚠️ **Limitations**
* May lag slightly in ranging markets.
* Late entries possible due to confirmation candle.
* Works best with additional volume or volatility filter.

PulseWave + DivergenceOverview
PulseWave + Divergence is a momentum oscillator designed to optimize the classic RSI. Unlike traditional RSI, which can produce delayed or noisy signals, PulseWave offers a smoother and faster oscillator line that better responds to changes in market dynamics. By using a formula based on the difference between RSI and its moving average, the indicator generates fewer false signals, making it a suitable tool for day traders and swing traders in stock, forex, and cryptocurrency markets.
How It Works
Generating the Oscillator Line
The PulseWave oscillator line is calculated as follows:
RSI is calculated based on the selected data source (default: close price) and RSI length (default: 20 periods).
RSI is smoothed using a simple moving average (MA) with a selected length (default: 20 periods).
The oscillator value is the difference between the current RSI and its moving average: oscillator = RSI - MA(RSI).
This approach ensures high responsiveness to short-term momentum changes while reducing market noise. Unlike other oscillators, such as standard RSI or MACD, which rely on direct price values or more complex formulas, PulseWave focuses on the dynamics of the difference between RSI and its moving average. This allows it to better capture short-term trend changes while minimizing the impact of random price fluctuations. The oscillator line fluctuates around zero, making it easy to identify bullish trends (positive values) and bearish trends (negative values).
Divergences
The indicator optionally detects bullish and bearish divergences by comparing price extremes (swing highs/lows) with oscillator extremes within a defined pivot window (default: 5 candles left and right). Divergences are marked with "Bull" (bullish) and "Bear" (bearish) labels on the oscillator chart.
Signals
Depending on the selected signal type, PulseWave generates buy and sell signals based on:
Crosses of the overbought and oversold levels.
Crosses of the oscillator’s zero line.
A combination of both (option "Both").
Signals are displayed as triangles above or below the oscillator, making them easy to identify.
Input Parameters
RSI Length: Length of the RSI used in calculations (default: 20).
RSI MA Length: Length of the RSI moving average (default: 20).
Overbought/Oversold Level: Oscillator overbought and oversold levels (default: 12.0 and -12.0).
Pivot Length: Number of candles used to detect extremes for divergences (default: 5).
Signal Type: Type of signals to display ("Overbought/Oversold", "Zero Line", "Both", or "None").
Colors and Gradients: Full customization of line, gradient, and label colors.
How to Use
Adjust Parameters:
Increase RSI Length (e.g., to 30) for high-volatility markets to reduce noise.
Decrease Pivot Length (e.g., to 3) for faster divergence detection on short timeframes.
Interpret Signals:
Buy Signal: The oscillator crosses above the oversold level or zero line, especially with a bullish divergence.
Sell Signal: The oscillator crosses below the overbought level or zero line, especially with a bearish divergence.
Combine with Other Tools:
Use PulseWave alongside moving averages or support/resistance levels to confirm signals.
Monitor Divergences:
"Bull" and "Bear" labels indicate potential trend reversals. Set up alerts to receive notifications for divergences.

Order Blocks & Breaker Blocks [LuxAlgo]The Order Blocks & Breaker Blocks indicator detects order blocks that can be turned into breaker blocks on the chart automatically once mitigated.
Users can determine the amount of bullish and bearish order/breaker blocks that display on their chart from within the settings menu.
🔶 SETTINGS
Swing Lookback: Lookback period used for the detection of the swing points used to create order blocks.
Show Last Bullish OB: Number of the most recent bullish order/breaker blocks to display on the chart.
Show Last Bearish OB: Number of the most recent bearish order/breaker blocks to display on the chart.
Use Candle Body: Allows users to use candle bodies as order block areas instead of the full candle range.
🔹 Style
Show Historical Polarity Changes: Allows users to see labels indicating where a swing high/low previously occurred within a breaker block.
🔶 USAGE
We have published several scripts covering the detection of order blocks previously, however, the concept of breaker blocks was not yet introduced.
When price mitigates an order block, a breaker block is confirmed. We can eventually expect price to trade back to this breaker block offering a new trade opportunity.
We can see that this is similar to a change in polarity, where a support becomes a resistance after a breakout and vice versa.
This script highlights regular order blocks as solid extended areas on the chart and breaker blocks as dashed lines with dual-colored areas. The color change and dashed line starts at the location where the order block was mitigated.
Using a higher "Swing Lookback" setting will return longer term order/breaker blocks on the chart.
Users can optionally enable "Historical Polarity Changes" labels within the settings menu to see where breaker blocks might have provided an effective trade setup previously.
The "Historical Polarity Changes" setting is disabled by default & is most effective using replay mode as the labels are backpainted.
The order blocks & breaker blocks themselves can be used in real-time as they are detected based on the swing length & previous breaker blocks being mitigated.

TM_SWING_LEVELSwing level Indicator shows overall market price structure of market for Swing Position.
Terminology Use ==> Price Line, Price Level name and Price level
Timeframe ==> Use proper Signal with swing trend on 1 Hour or Upper time frame (Best if Use with 1 Hour chart or 1 Day chart).
What to Identify ==> Overall market price structure for the Swing Period
How to Use ==>
There are Many Line in price level chart
Green/red with Solid for important area of support or resistance
other dotted lines are for retracement or extension of prices.
Important Structure==> Price behaviors on all lines of possible support and resistance
Use market structure, chart pattern, trend lines for more support.
Entry ==>
Let’s wait the proper area of support or resistance (Area of Value in case of trend pattern use)
Exit ==>
SL of swing high/low out of market structure with proper risk management and target with proper Risk/ Reward Ratio

Moving Average Signals : Support ResistanceThis indicator plots a Simple Moving Average (default 50-period, adjustable) and highlights potential bounce or rejection signals when price interacts with the SMA.
It is designed to identify moments when price tests the moving average from one side and then continues in the prior direction, signaling a possible continuation trade.
🔴 Red Triangle (Bearish Rejection)
A red triangle is plotted above the bar when:
Price has been trading below the SMA.
Price tests the SMA from below (the high touches or pierces the SMA but closes back below it).
Price then continues lower on the next bar.
This suggests the SMA acted as resistance and the downtrend may resume.
🟢 Green Triangle (Bullish Rejection)
A green triangle is plotted below the bar when:
Price has been trading above the SMA.
Price tests the SMA from above (the low touches or pierces the SMA but closes back above it).
Price then continues higher on the next bar.
This suggests the SMA acted as support and the uptrend may resume.
⚡ HOW TO USE IN TRADING
Trend Confirmation
Use this indicator in trending markets (not choppy ranges).
A rising SMA suggests bullish trend bias; a falling SMA suggests bearish trend bias.
Signal Entry
Green Triangle: Consider long entries when the SMA supports price and a bullish continuation is signaled.
Red Triangle: Consider short entries when the SMA rejects price and a bearish continuation is signaled.
Stop-Loss Placement
Place stops just beyond the SMA or the rejection candle’s high/low.
Example: For a red signal, stop above the SMA or rejection candle’s high.
Take-Profit Ideas
Target prior swing highs/lows or use risk/reward multiples (e.g., 2R, 3R).
You can also trail stops behind the SMA in a strong trend.
Filters for Higher Accuracy (optional)
Confirm signals with volume, momentum indicators (e.g., RSI, MACD), or higher-timeframe trend.
Avoid trading signals against strong higher-timeframe bias.

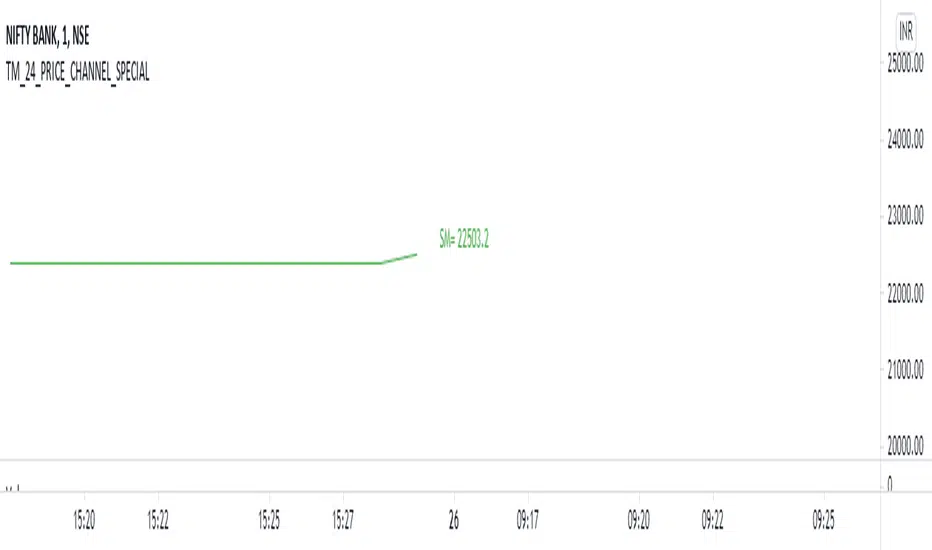
TM_24_PRICE_CHANNEL_SPECIALTM_24_PRICE_CHANNEL_SPECIAL Indicator shows overall trend or market direction for Intraday / Swing Position along with Uper and lower levels.
Terminology Use ==> .
Display and Interpretation ==>
This indicator help to identify 4 major things:-
1. Area of order Buildup
2. Price Strength
3. Direction
4. Volatility
Time frame ==> Use proper Signal with swing trend on 1 minute, 3 minute 5 minute, 15 minute time frame
What to Identify ==> Overall Trend for the intraday and swing Period
How to Use ==>
See how and order buildup is seen and current order position. Also area for volatility and expected movement in price direction
Note: - Use market structure, chart pattern, trend lines and price action parameter for more confirmation.
Entry ==>
Let’s wait the proper area of support or resistance ( Area of Value in case of trend pattern use)
Exit ==>
SL of swing high/low out of market structure with proper risk management and target with proper Risk/ Reward Ratio
Use the Below Contacts to Access this Indicator
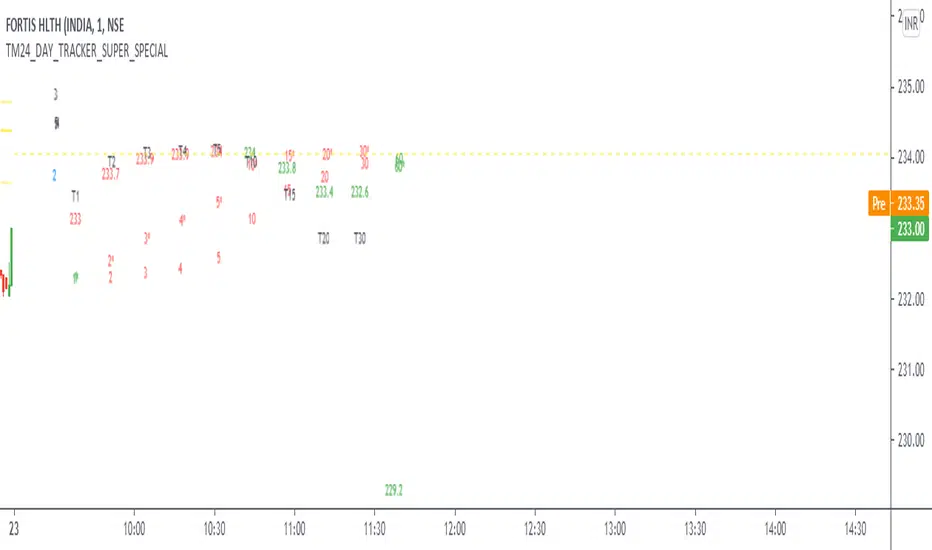
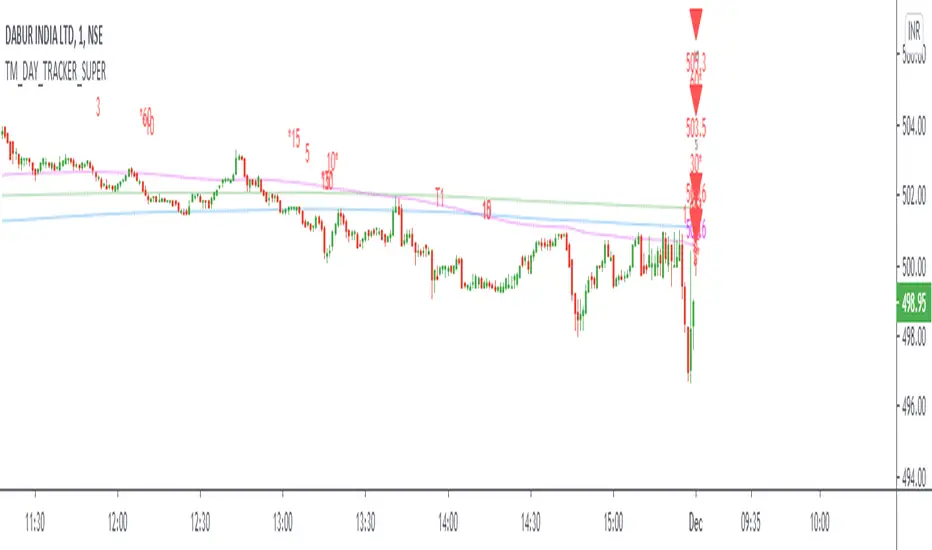
TM_DAY_TRACKER_SUPER_SPECIALTM_DAY_TRACKER_SUPER_SPECIAL Indicator shows overall trend or market direction for Intraday / Swing Position along with Buy or sell signal.
Terminology Use ==> B- Buy, S- Sale Signal, and Numbers are to show time frame indication there is presence of buyer or seller like B1 for buy signal on 1 minute time frame etc.
Display and Interpretation ==> Buy Sale Signal in B/S , Digit with 1-3-5-10-15-30-60-D for different time frames, Value with Triangle mark shows possible direction of momentum
This indicator help to identify 4 major things:-
1. Area of order Buildup
2. Price Strength
3. Direction
4. Volatility
Time frame ==> Use proper Signal with swing trend on 1 minute, 3 minute 5 minute, 15 minute time frame
What to Identify ==> Overall Trend for the intraday and swing Period
How to Use ==>
See how and order buildup is seen and current order position. Also area for volatility and expected movement in price direction
Note: - Use market structure, chart pattern, trend lines and price action parameter for more confirmation.
Entry ==>
Let’s wait the proper area of support or resistance ( Area of Value in case of trend pattern use)
Exit ==>
SL of swing high/low out of market structure with proper risk management and target with proper Risk/ Reward Ratio
Use the Below Contacts to Access this Indicator
TM24_SWING_LEVELTM24_Swing_level Indicator shows overall market price structure of market for Swing Position.
Terminology Use ==> Price Line, Price Level name and Price level
Timeframe ==> Use proper Signal with swing trend on 1 Hour or Upper time frame (Best if Use with 1 Hour chart or 1 Day chart).
What to Identify ==> Overall market price structure for the Swing Period
How to Use ==>
There are Many Line in price level chart
Green/red with Solid for important area of support or resistance
other dotted lines are for retracement or extension of prices.
Important Structure==> Price behaviors on all lines of possible support and resistance
Use market structure, chart pattern, trend lines for more support.
Entry ==>
Let’s wait the proper area of support or resistance (Area of Value in case of trend pattern use)
Exit ==>
SL of swing high/low out of market structure with proper risk management and target with proper Risk/ Reward Ratio

TM_DAY_TRACKER_SUPERDay_Tracker_Super Indicator shows overall trend or market direction for Intraday / Swing Position along with Buy or sell signal.
Terminology Use ==> B- Buy, S- Sale Signal, and Numbers are to show time frame indication there is presence of buyer or seller like B1 for buy signal on 1 minute time frame etc.
Display and Interpretation ==> Buy Sale Signal in B/S , Digit with 1-3-5-10-15-30-60-D for different time frames, Value with Triangle mark shows possible direction of momentum
This indicator help to identify 4 major things:-
1. Area of order Buildup
2. Price Strength
3. Direction
4. Volatility
There are 3 Line in trend chart
Green for positive trend, red for negative trend
line change color based on trend change
least dark "Green/Red" shows main trend and work as major trend line". It describe which side market will take momentum and whenever price come to this area, very important for position build up either long side or short side"
light dark "Green/Red" work as primary support / resistance and area of value. During the price movement price takes support or resistance here and bounce back or reverse back"
most dark "blue/purple" work as volatility line . This is area of volatility and direction to main trend. Price crossing above or below will give huge direction movement
==> 2 line in common color "Green/Red" shows main trend
Use market structure, chart pattern, trend lines for more support..
There is 1 dot in chart, This dot show accumulation or distribution price, Green / Red line shows market strength. Signal with 1-3-5-10-15-30-60-D shows active order position over time frame and 1 with Price Value like show area of momentum or volatility . Signal on higher the time frame , more strong momentum
Time frame ==> Use proper Signal with swing trend on 1 minute, 3 minute 5 minute, 15 minute time frame
What to Identify ==> Overall Trend for the intraday and swing Period
How to Use ==>
See how and order buildup is seen and current order position. Also area for volatility and expected movement in price direction
Note: - Use market structure, chart pattern, trend lines and price action parameter for more confirmation.
Entry ==>
Let’s wait the proper area of support or resistance ( Area of Value in case of trend pattern use)
Exit ==>
SL of swing high/low out of market structure with proper risk management and target with proper Risk/ Reward Ratio
Use the Below Contacts to Access this Indicator
TM_DAY_TRACKER_ADVANCEDay_Tracker_ Advance Indicator shows overall trend or market direction for Intraday / Swing Position along with Buy or sell signal.
Terminology Use ==> B- Buy, S- Sale Signal, and Numbers are to show time frame indication there is presence of buyer or seller like B1 for buy signal on 1 minute time frame etc.
Display and Interpretation ==>
This indicator help to identify 4 major things:-
1. Area of order Buildup
2. Price Strength
3. Direction
4. Volatility
There is 1 dot in chart, This dot show accumulation or distribution price, Green / Red line shows market strength. Signal with 1-3-5-10-15-30-60-D shows active order position over time frame and 1 with Price Value like show area of momentum or volatility . Signal on higher the time frame , more strong momentum
Time frame ==> Use proper Signal with swing trend on 1 minute, 3 minute 5 minute, 15 minute time frame
What to Identify ==> Overall Trend for the intraday and swing Period
How to Use ==>
See how and order buildup is seen and current order position. Also area for volatility and expected movement in price direction
Note: - Use market structure, chart pattern, trend lines and price action parameter for more confirmation.
Entry ==>
Let’s wait the proper area of support or resistance ( Area of Value in case of trend pattern use)
Exit ==>
SL of swing high/low out of market structure with proper risk management and target with proper Risk/ Reward Ratio
TM_DAY_TRACKERDay Tracker Indicator shows overall trend or market direction for Intraday / Swing Position along with Buy or sell signal.
Terminology Use ==> B- Buy, S- Sale Signal, and Numbers are to show timeframe indication there is presence of buyer or seller like B1 for buy signal on 1 minute timeframe etc.
Display and Interpretation ==> There are 3 lines in trend chart, line-1 light thin, line-2 dark less thick and line-3 bold thick. These lines having Green or Red color according to market signal and trend change where green for positive trend, red for negative trend
line-1 represents market strength and order build up; line-2 represents volatility or momentum ; line-3 represents market trend or direction
Timeframe ==> Use proper Signal with swing trend on 1 minute, 3 minute 5 minute, 15 minute time frame
What to Identify ==> Overall Trend for the intraday and swing Period
How to Use ==>
line-1 light thin "Green/Red" work as primary support / resistance and area of value. During the price movement price takes support or resistance here and bounce back or reverse back"
line-2 dark less thick "Green/Red" work as volatility line. This is area of volatility and direction to main trend. Price crossing above or below will give huge direction movement
line-3 bold thick "Green/Red" work as trend line or market direction line. This is area where strong or weak price will decide its direction
Note: - Use market structure, chart pattern, trend lines and price action parameter for more confirmation.
Entry ==>
Let’s wait the proper area of support or resistance ( Area of Value in case of trend pattern use)
Exit ==>
SL of swing high/low out of market structure with proper risk management and target with proper Risk/ Reward Ratio
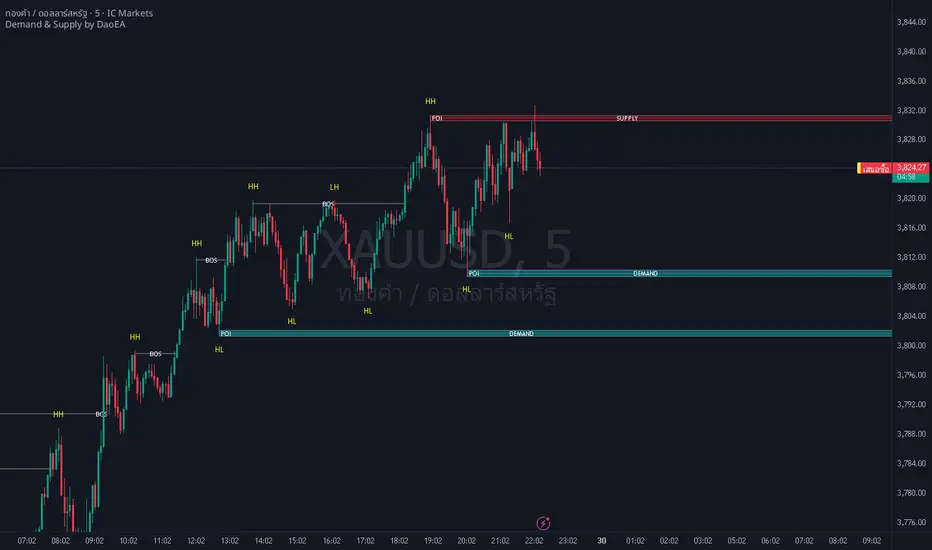
Demand & Supply by DaoEADemand & Supply by DaoEA
This indicator is designed to help traders identify key demand and supply zones, displaying strong price action patterns such as Pin Bar, Engulfing, Hammer, and Shooting Star to confirm reversal points.
Key Features
Automatically identifies Supply & Demand Zones and extends them to the right.
Displays Break of Structure (BOS) when prices break out of these zones.
Tracks Swing Highs/Lows and analyzes HH, HL, LH, and LL.
Highlights strong price action patterns such as Bullish/Bearish Pin Bars, Engulfing, Hammer, and Shooting Star.
Customizable zones, colors, and labels.
Overlay zone protection. To avoid over-cluttering the chart,
Usage
Use with higher timeframes (H1 and above) to identify high demand and supply points.
Switch to smaller timeframes (M15–M30) to identify entry and exit opportunities.
Wait for a strong BOS + PA to confirm the signal.
Suitable for scalpers, swing traders, and Smart Money Concept (SMC) traders who want to clearly understand market structure.
ICT Sweep + FVG Entry (v6) • Pro Pack 📌 ICT Sweep + FVG Entry Pro Pack
This indicator combines key ICT price action concepts with practical execution tools to help traders spot high-probability setups faster and more objectively. It’s designed for scalpers and intraday traders who want to keep their chart clean but never miss critical market structure events.
🔑 Features
Liquidity Pools (HTF)
• Auto-detects recent swing highs/lows from higher timeframes (5m/15m).
• Draws both lines and optional rectangles/zones for clear liquidity areas.
Liquidity Sweeps (BSL/SSL)
• Identifies when price sweeps above/below liquidity pools and rejects back.
• Optional Grade-A sweep filter (wick size + strong re-entry).
Fair Value Gaps (FVGs)
• Highlights bullish/bearish imbalances.
• Optional midline (50%) entry for precision.
• Auto-invalidation when price fully closes inside the gap.
Killzones (New York)
• Highlights AM (9:30–11:30) and PM (14:00–15:30) killzones.
• Option to block signals outside killzones for higher strike rate.
Bias Badge (DR50)
• Displays if price is trading in a Bull, Bear, or Range context based on displacement range midpoint.
SMT Assist (NQ vs ES)
• Detects simple divergences between indices:
Bearish SMT → NQ makes HH while ES doesn’t.
Bullish SMT → NQ makes LL while ES doesn’t.
SL/TP Helper & R:R Label
• Automatically draws stop loss (at sweep extreme) and target (opposite pool or recent swing).
• Displays expected Risk:Reward ratio and blocks entries if below your chosen minimum.
Filters
• ATR filter ensures signals only appear in sufficient volatility.
• Sweep quality filter avoids weak wicks and fake-outs.
🎯 How to Use
Start on HTF (5m/15m) → Identify liquidity zones and bias.
Drop to LTF (1m) → Wait for a liquidity sweep confirmation.
Check for FVG in the sweep’s direction → Look for retest entry.
Use the SL/TP helper to validate your risk/reward before taking the trade.
Focus entries during NY Killzones for maximum effectiveness.
✅ Why this helps
This tool reduces screen time and hesitation by automating repetitive ICT concepts:
Liquidity pools, sweeps, and FVGs are marked automatically.
Killzone timing and SMT divergence are simplified.
Clear visual signals for entries with built-in RR filter help keep your trading mechanical.
⚠️ Disclaimer: This script is for educational purposes only. It does not provide financial advice or guarantee results. Always use proper risk management.
